Statistical Simplification an example of multi-compilation
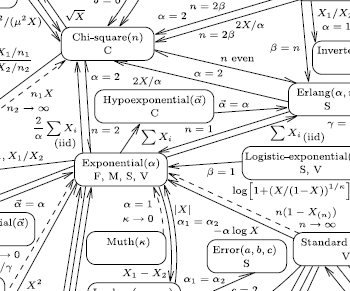
Lawrence Leemis, a statistician at Williams and Mary, recently published a wonderful interactive visualization on the reduction relationships of statistical distributions. (found via John Cook’s blog)
This excites me because it touches on one of my favorite topics
How do we reusably encode expert knowledge into computational systems?
The Big Challenge
Correct use of mathematical information can accelerate important computations by several orders of magnitude. Unfortunately the people who know the mathematics are not always the ones doing the computation. This results in substantial waste.
How do we integrate expert mathematical knowledge everywhere? One solution is to collaborate more. While collaboration is generally good it doesn’t scale well. As problems become more complex it is more difficult to find all of the necessary experts, especially for smaller relatively unimportant projects. Also, collaboration rarely results in reusable infrastructure. Statistical chemistry projects are rarely applicable to statistical biology problems despite their shared interest in statistics.
One Solution - Multi-Stage Compilation
We could write each expert’s knowledge into a single project and then connect many such projects into a multi-stage compiler. At each each stage we simplify the expression with the knowledge relevant at that stage. We must create a transformation between each pair of connecting stages. Ideally the conceptual distance between connected stages is small and so these transformations are easy.
This isn’t clearly the right solution. It is difficult to chain many small projects together and end up with efficient code. You need to find the right sequence of intermediate layers that are able to communicate mathematical information down to the lowest-level of computational code.
Relevance to SymPy.stats
SymPy.stats endeavors to be a transformation in such a toolchain. It converts stochastic expressions into integral expressions.
The surrounding infrastructure looks like this
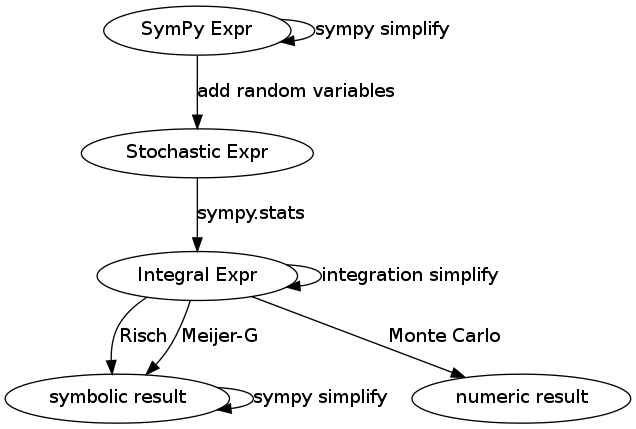
When SymPy expressions are imbued with random variables they form stochastic expressions. Sympy.stats transforms these into integral expressions which are then again converted through a variety of methods, either numeric (like Monte Carlo) or again symbolic.
Each stage within this pipeline presents us with the opportunity to simplify the expression with knowledge relevant to that stage. For example at the input and output SymPy Expr layers we make algebraic and trigonometric simplifications like the following
X + X -> 2*X
sin(x)**2 + cos(x)**2 -> 1
At the integration stage we might separate multivariate integrals if possible or use integration by parts.
Notice that there is no such simplification self-loop at the Stochastic Expr node. This is where the information in Leemis’ chart would fit.
A Failing of sympy.stats
Currently sympy.stats does not simplify stochastic expressions with expert knowledge; it converts directly from stochastic expressions to integral expressions without first applying known simplifications like what is encoded in Leemis’ chart. This causes some fairly embarassing failures
In [1]: from sympy.stats import *

In [2]: X = Normal('X', 0, 1)  # A standard normal random variable

In [3]: density(X**2)
Out[3]:
<< failure: unevaluated integral >>
Any statistician could tell you that the expression X**2 has a Chi Squared distribution which has a simple and well understood density. This relation is commonly known and commonly occurs in practice.
Because sympy.stats doesn’t know this it blindly takes the expression density(X**2) and converts it directly into an integral. The resulting integral is difficult and stumps the integration routines.* In this case knowing basic statistics would have turned an impossible problem into a trivial one.
Future work
We should encode relations on distributions into SymPy. The knowledge in Leemis’s chart could be written down as a knowledgebase of known transformations. Transformations like the following could solve our immediate problem.
Normal(0, 1) -> StandardNormal()
StandardNormal()**2 -> ChiSquared(1)
StandardNormal()**2 + ChiSquared(n) -> ChiSquared(n+1)
Each stage in the compilation pipeline presents us with an opportunity to apply expert knowledge. The Stochastic Expr stage is such an opportunity of which we are not currently taking advantage.
Leemis’s chart is written declaratively, highlighting which logical transformations are possible under which conditions. The new modules on unification and strategies should provide all of the necessary infrastructure to translate Leemis’ chart to functioning code. Writing a minimal simpliication scheme for the above problem might be as simple as
#    rewriterule(from-pattern, to-pattern, wilds)
p1 = rewriterule(Normal(name, 0, 1), StandardNormal(name), wilds=(name,))
p2 = rewriterule(StandardNormal(name)**2, ChiSquared(name, 1), wilds=(name,))
p3 = rewriterule(StandardNormal(name)**2 + ChiSquared(name, n),
                 ChiSquared(name, n+1), wilds=(name, n))

statsimp = exhaust(bottom_up(multiplex(p1, p2, p3)))
If anyone is interested in this I’d be happy to help out. This is the sort of project that really excites me but that I can’t currently justify time-wise.
blog comments powered by Disqus