Setup Data Source
from bokeh.models import ColumnDataSource
tasks = ColumnDataSource({'start': [], 'stop': [], 'color': [],
                          'worker': [], 'name': []})
Construct Plot around Data Source
from bokeh.plotting import figure
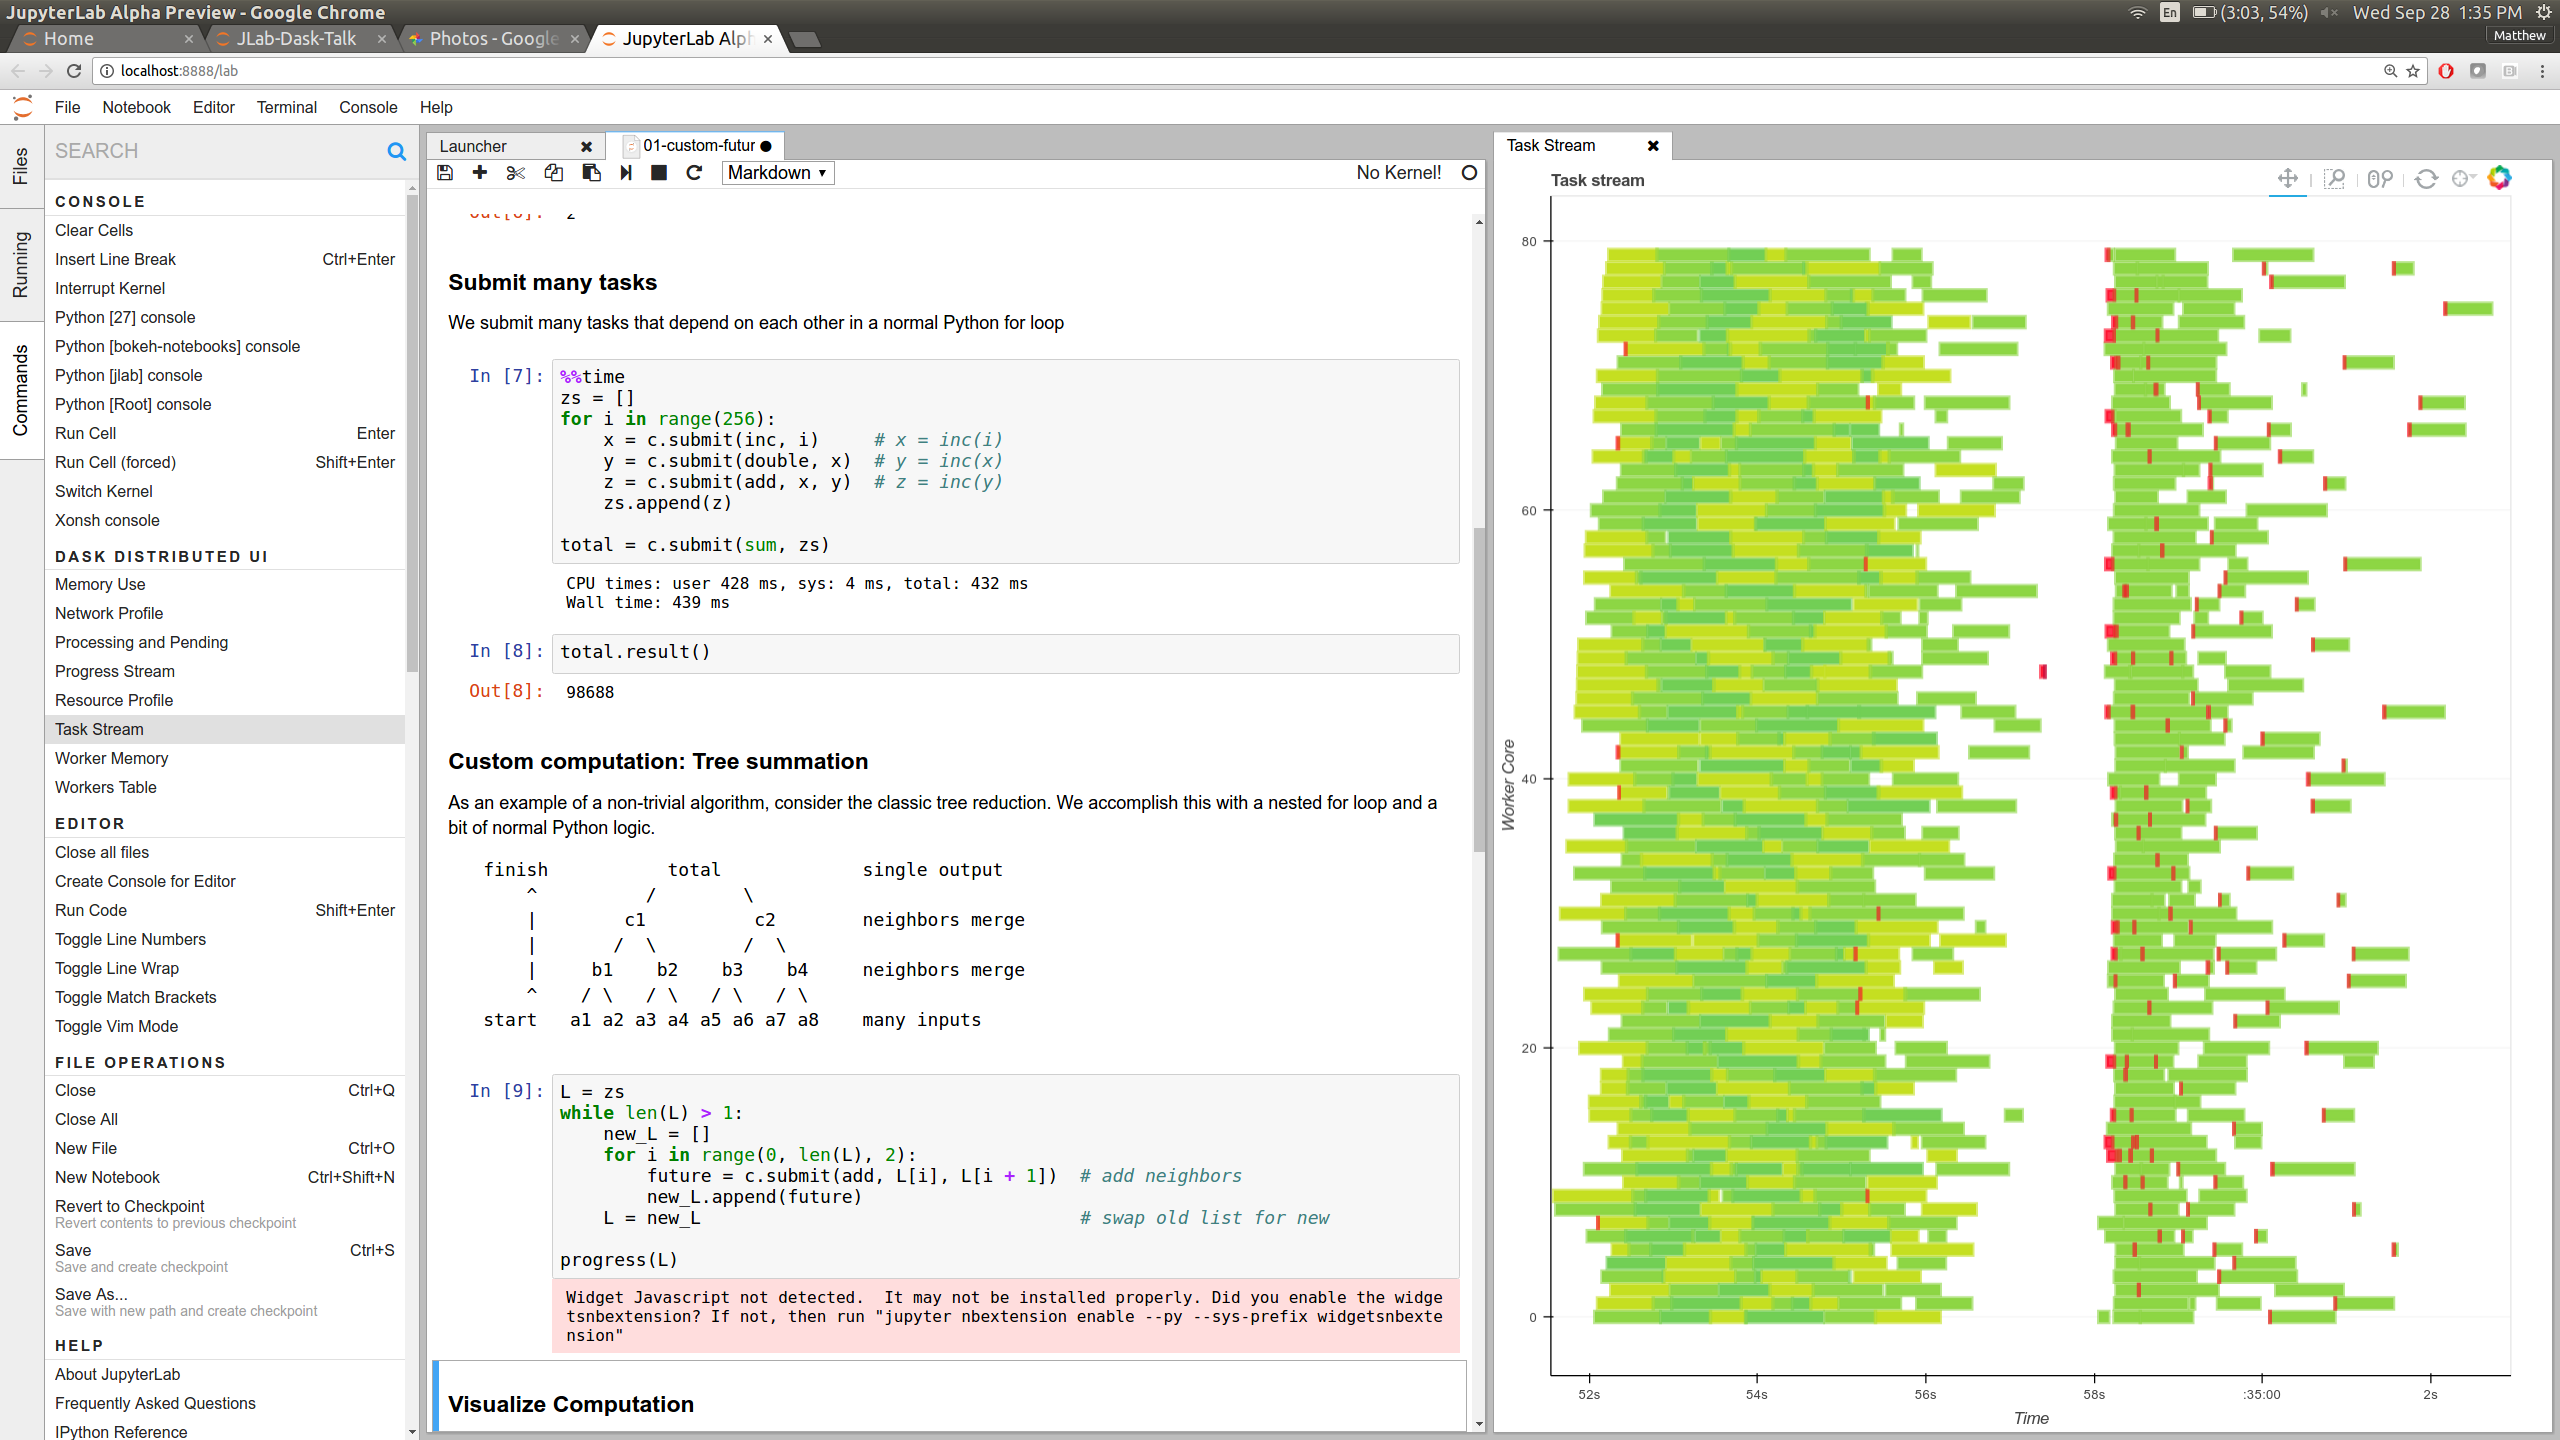
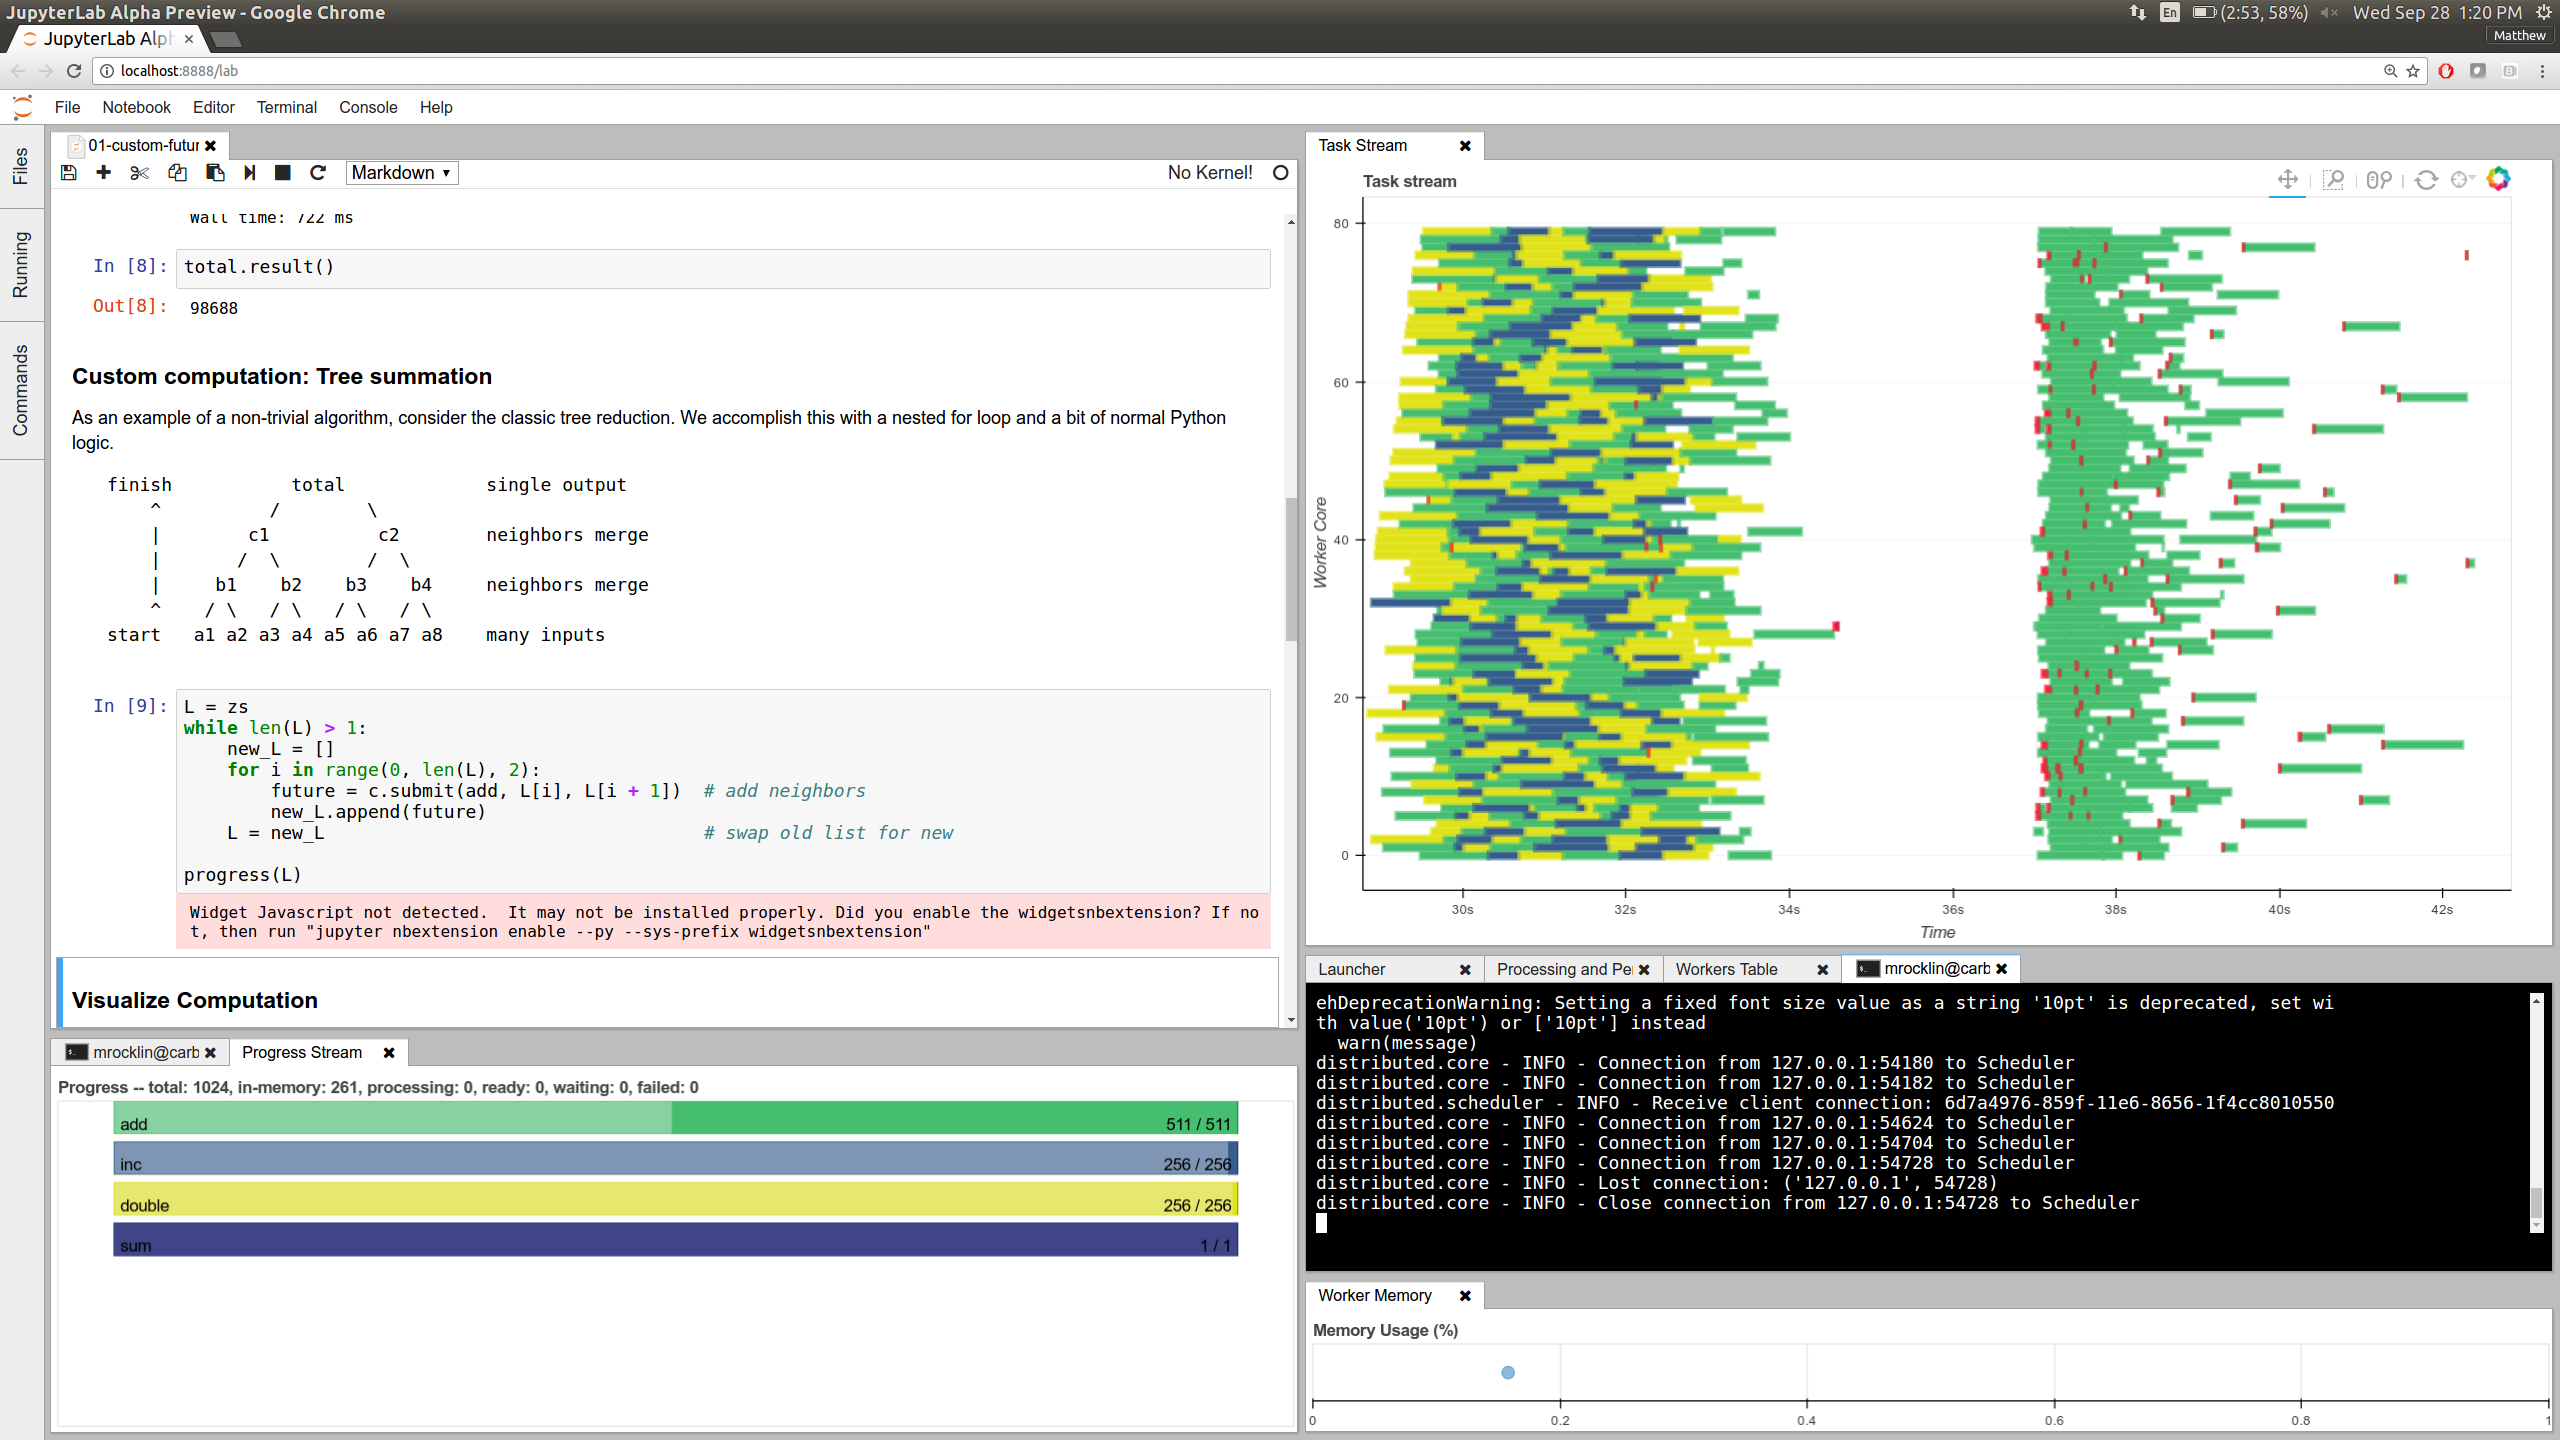
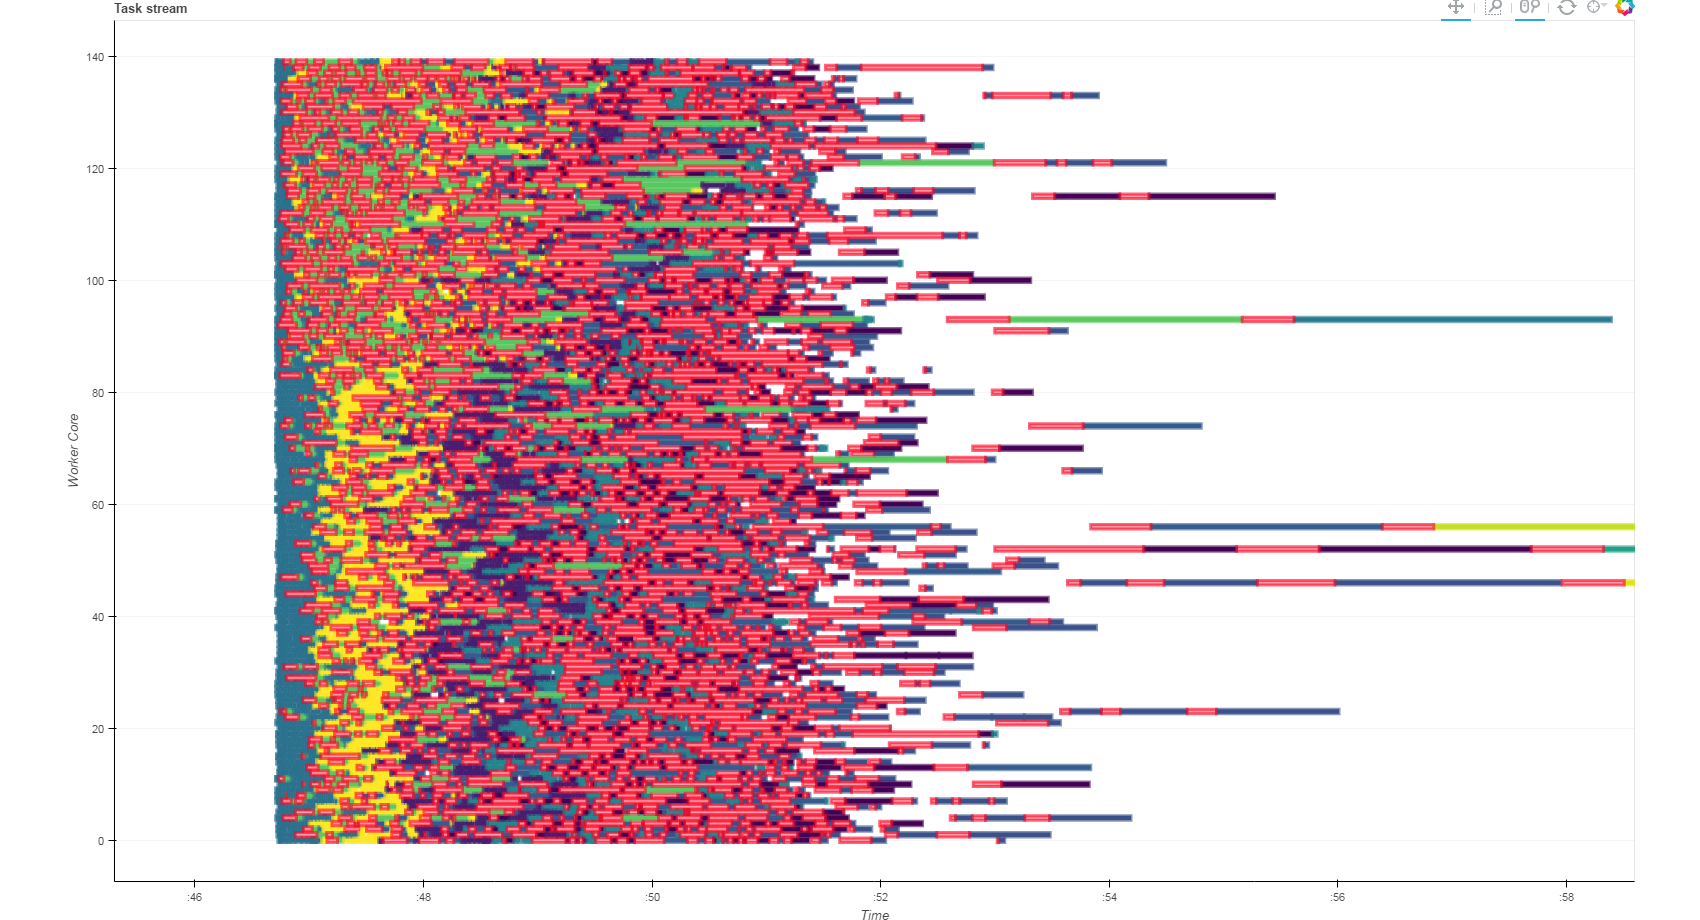
plot = figure(title='Task Stream')
plot.rect(source=tasks, x='start', y='stop', color='color', y='worker')
plot.text(source=tasks, x='start', y='stop', text='name')
Push to Data Source on Server
while True:
    collect_diagnostics_data()
    tasks.update({'start': [...], 'stop': [...], 'color': [...],
                  'worker': [...], 'name': [...]})