Lab: Lab 3 - Python
Goals
- Set up a basic Python development environment
- Use IPython
- Manipulate stock data
- Plot
To Start
Update your svn repository to download the materials for lab3.
cd username-152
svn up
There are different versions of Python on the department machines. We will run a small command to point your computer to the correct one. Make sure you are in your svn directory and type
cd lab3
source update_shell.sh
To verify that you are using the correct python please now type
which pythonand verify that you see
/stage/climate/SOFTWARE/epd-7.3-2-rh5-x86_64/bin/pythonHello World
In lab we will use a text editor and the command line to write and run programs. We will not use Eclipse. While IDEs like Eclipse do exist for Python they tend not to be as useful.
Open the file hello.py using a text editor. If you don’t have a favorite text editor we suggest gedit or bluefish. You can access these either by navigating the Applications menu (Applications:Programming:BlueFish) or by just typing in gedit hello.py or bluefish hello.py into the terminal.
Enter the code
print("Hello World")into the hello.py file and press save. Now run this program with the command
python hello.pyIf your terminal isn’t responding right now (this is a common problem) it’s because it’s busy running gedit or bluefish. You can easily make a new terminal by pressing Ctrl-Shift-N when you’re in the terminal window. Now try running python hello.py again. It’s ok to have multiple terminal windows open at once.
Some more Python
Before we work with a real example lets make sure that we’re comfortable writing functions and loops. Open up a new python file in your text editor, play.py. Try a few examples from class. In particular try to do the following.
- Print out the squares of the numbers 1 to 10
- Write a function
printSquaresthat prints out the squares of the numbers 1 to n, where n is an input to the function. Make sure that this function works. - Write a separate function
listSquaresthat - creates a list - appends each of the squares from 1 to n onto this list in order - returns this list
As a result printSquares(5) and print(listSquares(5)) should both print out the numbers [1, 4, 9, 16, 25] (although the formatting will be different between the two).
IPython
IPython is an interactive console. You can type in Python expressions and have them evaluated for you immediately. This is not a good way to develop large amounts of code but it is a great way to play with the code you have written.
Open up another terminal (Ctrl-Shift-N) and type in
ipython --pylabThis should open up a new, more colorful version of your terminal. Type in
2 + 2and press enter. You should see 4. Type in
run play.pyTo run all of the code you have written in the file play.py. In particular the functions that you have defined should now be available in IPython. Try them out.
printSquares(10)Stocks
With our remaining time we will play with data from Yahoo! finance. Today we will use code written by someone else to interact with Yahoo’s online database.
From IPython run the file ystockquote.py
run ystockquote.pyType in get and press tab. This will show you all the functions that start with get. Press enter a few times or q to get out of this list. Type in
get_price("GOOG")This gets the current price of the stock with the ticker symbol, “GOOG”. This ticker symbol represents the company, Google. If the market were still open you could call this function again and it would give you a new price. Its values are accurate to about 10 seconds.
Every function in Python has a small documentation string that tells you how it works. See the help string for get_price from within IPython by typing
help(get_price)Press q to quit the help screen after you have finished reading.
Historical prices
The goal of this lab is to produce an image like what is on the right. This image plots the stock price of Google for the year 2011.
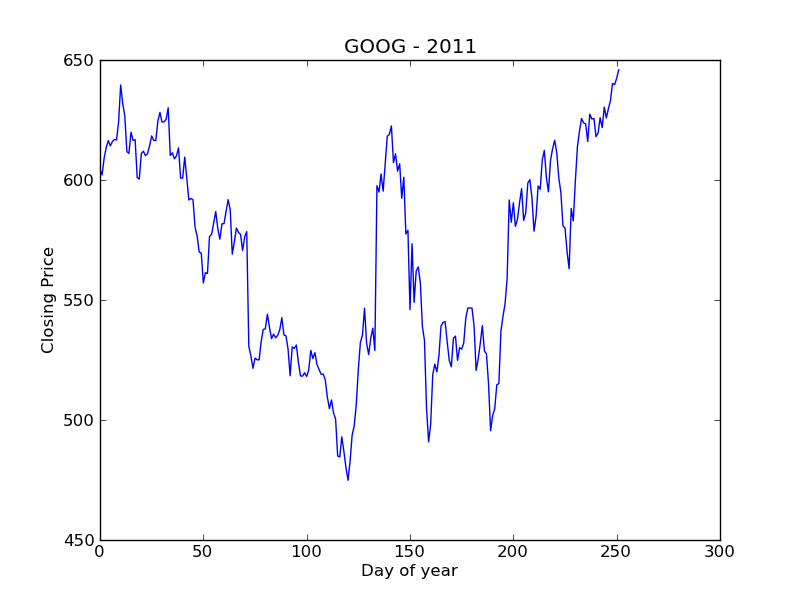
We can get the necessary information to produce this plot from the function get_historical_prices. Look at the help string for this function.
Run get_historical_prices in IPython to get the historical prices for the year 2011. What is the type of the return value?
In the following code
data = get_historical_prices(...)
L = data[3]
val = L[4]
What are the types of data, L, and val? If you can not answer this on your own use the function type on these variables to see the correct answer.
If we are able to convert this data into a single list of the floats then there is a function plot that will plot them for us. We have data in one form and need to convert it to another. This is a very common problem.
Open up a new file stock.py and write code to solve this problem. At the top of this program type in
from ystockquote import *This is the equivalent of run ystockquote.py but works within .py files (run only works in ipython). We suggest that you break up this problem into the following functions.
- Write a small function which takes in a single list (like
Lordata[i]in the above example) and returns the closing price as a float. You can use the functionfloatto turn a string into a float. - Write a function which takes in a list of lists (like data above) and returns a list of floats of closing prices. It should use the previous function.
- Write a function which takes in a stock symbol (like “GOOG”) and returns a list of closing prices for the year 2009.
- There are two complications * Data returned from
get_historical_pricesis in reverse order. You can reverse a list,Lby typingL = list(reversed(L))* The first 0th entry in data is different from the rest. You can select all but the first element of a list by usingL[1:]You might want to try this in IPython first to understand what is going on. - Make sure that your functions work
Plotting
When we ran IPython we did it with the command
ipython --pylabThe second entry --pylab opened ipython in plotting mode. In particular it imported all of the functionality of the matplotlib library, the standard plotting library for Python.
Matplotlib has a number of very useful functions. You might want to take a look at their help stings. In particular today we will use
plot    -- plot a list of floats
title   -- add a title
xlabel  -- add a label on the x axis
ylabel  -- add a label on the y axis
cla     -- clear the plot
plot is particularily useful. If you give it a list of floats it will plot them on the screen. If you give it two lists of floats it will plot them as X-Y coordinates. There are a number of options to select color, line style, etc….
If you have successfully completed the last section you should have such a list of floats. Call plot on it from within IPython.
Use title, xlabel, and ylabel to add some text to your figure.
Now that we know how these functions work, make a function plotTicker in stocks.py that takes a ticker symbol and causes a plot to appear on the screen. To use the plotting functions in stocks.py you will need to import them by adding the following line to the top of stocks.py
from pylab import *If you want to keep going
- Make a function which plots a symbol for a specific year.
- Make a function which plots a list of symbols. Search for help on the
legendfunction to produce a legend for your plot, it takes a tuple of strings - Unit-test your code