Lab: Lab 1 - Eclipse
Welcome to lab. Lab is for you to try out new technology or ideas with an instructor present to answer questions immediately if they arise.
SVN
We will use SVN to communicate homework between the instructor, students and graders. After lab you are encouraged to read a basic document about using SVN
For now, please open up a terminal Ctrl-Alt-T and type in the following commands
cd
svn co https://phoenixforge.cs.uchicago.edu/svn/username-152
cd username-152
ls
but replace username with your CNetID. This downloads a special directory that will contain all of your homeworks. The ls command lists all of the files in this directory. You should see lab1-pow and hw1 subdirectories.
Quick Linux Tip: You can copy and paste in Linux very easily with your mouse. To copy just select the text by clicking and dragging. To paste middle click where you want it to go. That’s it.
Eclipse
Today we focus on learning how to use Eclipse. Eclipse is an Interactive Development Environment (IDE) that we’ll use to develop projects in C. This means that it has all of the tools required to develop and compile C code in one single program. If you like it’s like BlueFish combined with gcc. We’re using it because it has some other, nicer features that combine these two.
Eclipse can be opened by selecting Applications : Programming : Eclipse in the upper right of your screen or by opening a terminal (ctrl-alt-T) and typing eclipse.
The first time you run Eclipse, you will be asked to choose a location for your workspace. The workspace is where Eclipse will store all your files. By default, the workspace is:
/home/username/workspaceWhere username is your CS account username. Change this to point to your SVN directory. I.e. change it to
/home/username/username-152Unless you want to be asked for your workspace location every time you start Eclipse, make sure you check “Use this as the default and do not ask again”.
Next, you will be shown a “Welcome to Eclipse” screen where you will be able to access tutorials, help documents, … Choose “Workbench” in the upper right to enter the Eclipse IDE proper. You should now see something like the following:
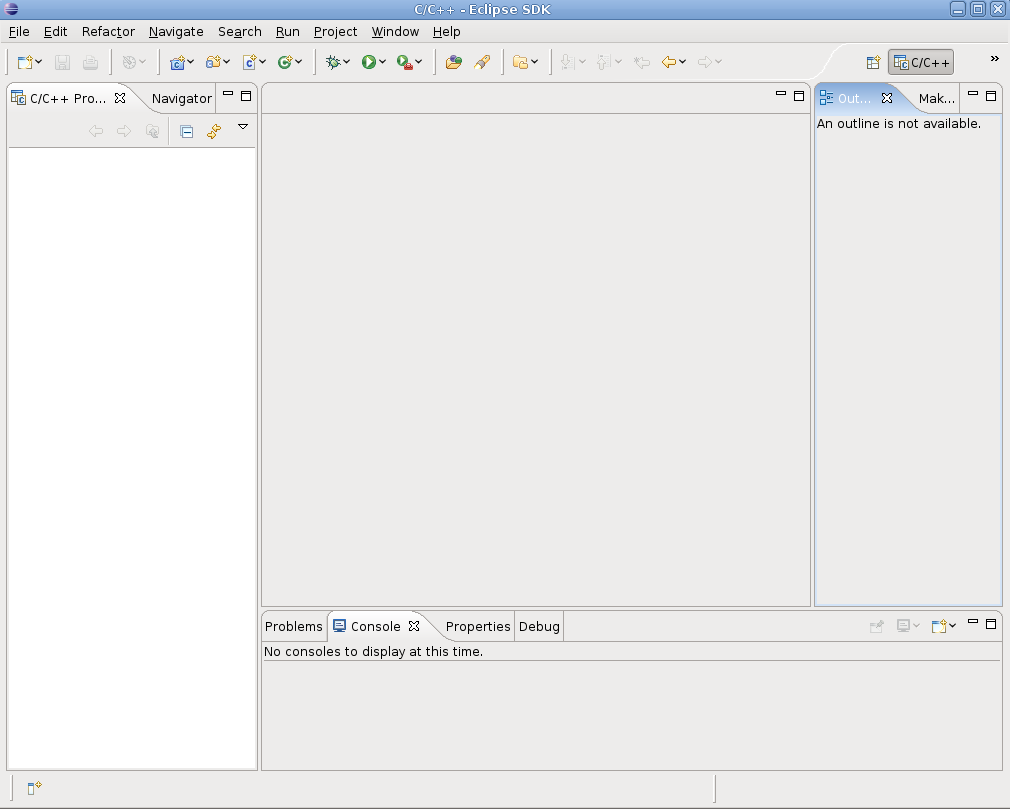
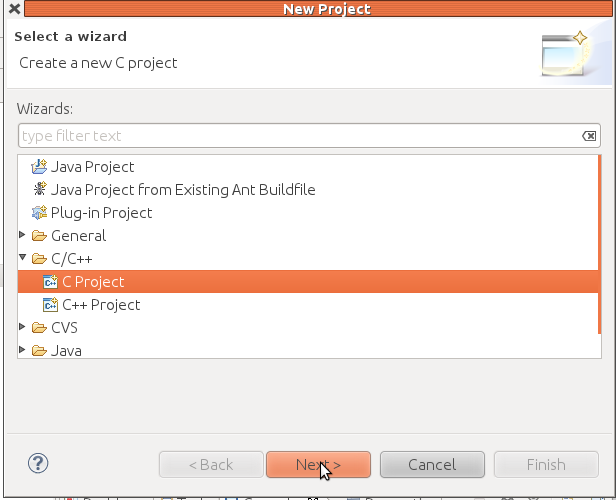
The IDE is currently empty, and we need to create a new project to be able to start coding. To do this, select menu File : New : Project. You will be shown the following screen, where you need to choose C/C++ : C Project.
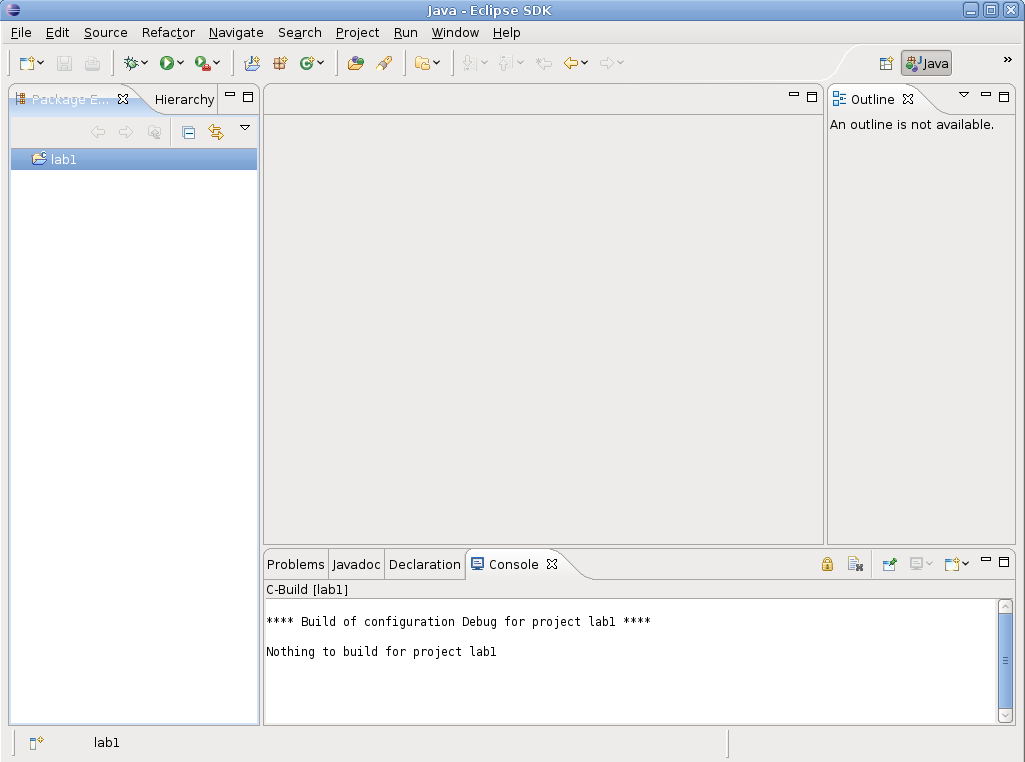
You’ll have to choose a name for your project. This can be anything you like but can not include spaces. lab1 is a fine name for today’s project. Select Executable : Empty Project and click Finish
Next you may be shown a screen “Switch to C/C++ Perspective”. You can safely press Yes without changing any settings. Now you will see your first project appear as an icon on the left panel.
Next we’ll add a .c source file which will hold our code. Right click on lab1, select New : Source File. Name the file helloworld.c and press finish. Your screen should now look like this:
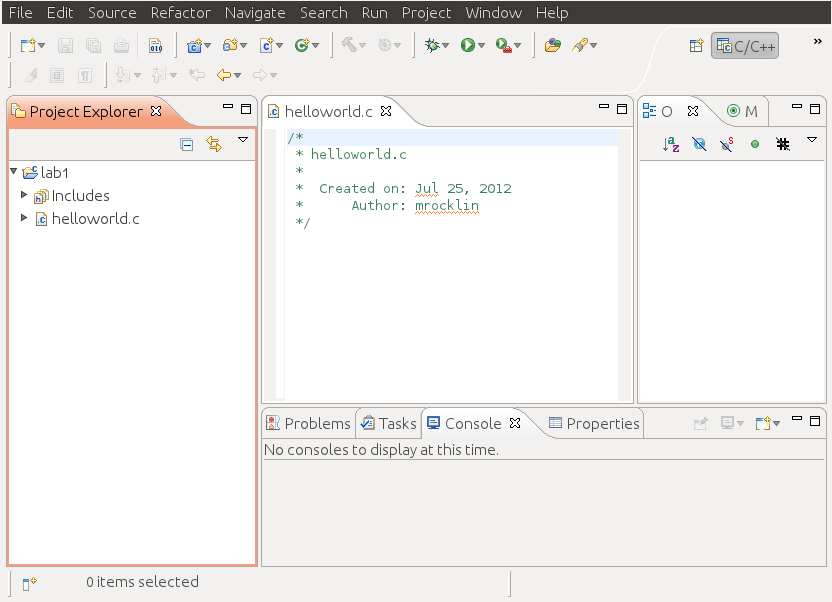
The center panel is an editing window for the file helloworld.c. The bottom panel tells us what errors we have (currently empty) and also displays our output.
Lets build a simple hello world C program in Eclipse. Write the following code into the code editing panel (center) just below the comments.
#include <stdio.h>
void main()
{
printf("Hello Eclipse!\n");
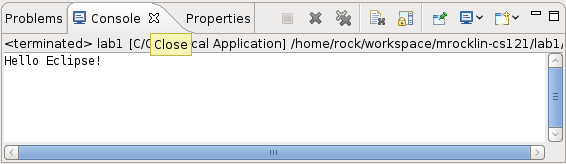
}Now lets run this program by right clicking on the lab1 project icon, selecting Run As : Run Local C/C++ Application. The bottom panel is now showing the Console tab. Console holds the output of the program. You can switch to look at compilation problems any time by clicking on the “Problems” tab.
Great! We can now use Eclipse to create, edit, compile and run files. We could do all these things before with gedit, gcc and the terminal so why Eclipse? Eclipse has two particularly useful features.
Inline Errors
First, Eclipse will locate and highlight syntax errors in your program each time you save. Try this now by intentionally creating at least three bugs in your program, trying to run, and then seeing which errors occur in the problems tab. Try producing the following errors.
- Remove a semicolon
- Capitalize
printftoPrintf - Assign to a variable that has not yet been declared (i.e. write
age=13;without writingint age;above it.
You should note the error messages that occur in the bottom panel. These messages look very strange at first but you will learn to recognize and understand them. Also note how Eclipse will highlight the bad line of code. If you hover your mouse over the highlighted line it will give you the appropriate error message. It is a good idea to see which messages are caused by which errors you create. Building this understanding now will help you find bugs in the future.
Using the Eclipse Debugger
Second, we use Eclipse for its debugger. The Eclipse debugger allows us to step through a program exactly as a computer executes it. This is very useful for finding difficult bugs.
There is an example in the lab1-pow sub-directory in your svn directory. Import it into Eclipse by making a new C project with the name lab1-pow
Double click on the pow.c file within this project and look at the main function in the code. It initializes three integer variables a, x, p and then gets values for these variables from the user using the scanf function.
scanf is like printf in reverse. It takes input from the console and pushes it into a variable. We will use it only rarely in this class.
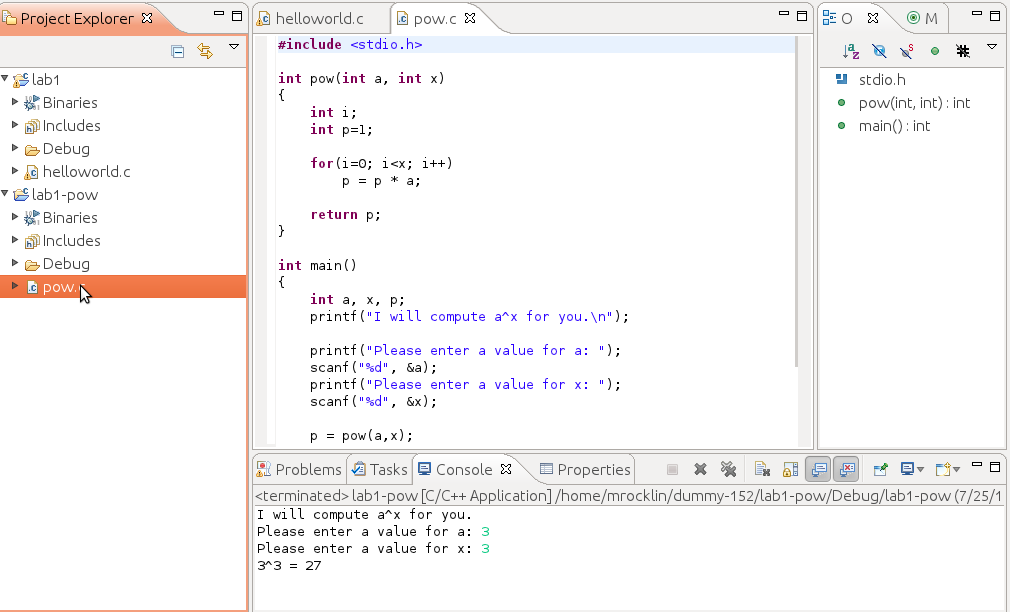
main then computes a raised to the power x using the function pow and prints the value to the screen. Run this program and test it for yourself. You’ll need to enter values for a and x into the console tab when requested.
Use this program to compute 2 raised to the power 13 and then run it again to compute 3 raised to the power 4.
At this stage your screen should look something like this:
Now we’re going to use the debugger to step through the program and see what it does, line by line. We start by setting a debug point at the beginning of the main function. Do this by double clicking on the thin vertical bar just to the left of the code. A small blue “point” should appear as shown below.
Now, rather than “Run” the program, we’ll “Debug” it. Right click on the lab1_pow project icon, select Debug As : Debug Local C/C++ Application. If it asks you if you’d like to switch to the “debug perspective” the answer is Yes. You will be able to switch back any time by clicking on the “C/C++” button on the upper right of the program or by going to Window : Open Perspective : C/C++
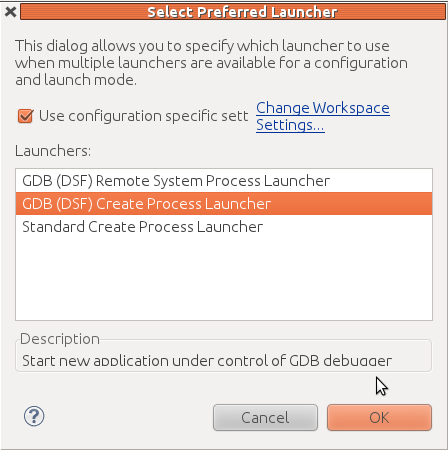
You will need to select which debugger you’d like to use. Check the box at the top and select the middle option
The Debug perspective offers several tabs with lots of interesting information. However, for basic debugging, we will only be interested in two tabs: the one actually containing our program and the “Variables” tab.
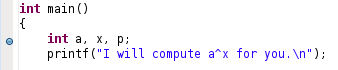
Let’s start with the code editing panel. Notice how the first executable line is highlighted:
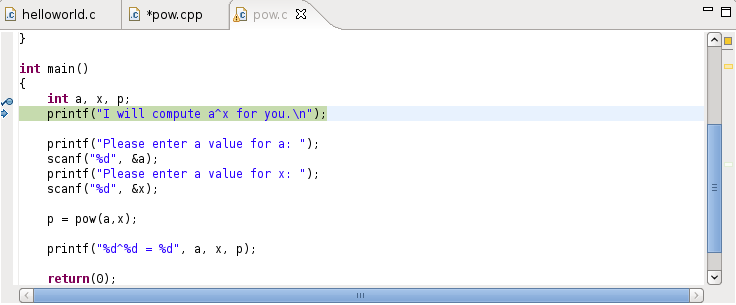
This means that the debugger is ready to process that line. However, it will not do so until we instruct it to. Before doing that, look at the Variables tab:
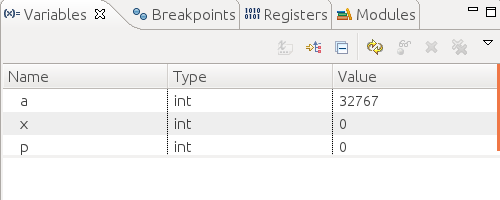
You will see a list of all the variables declared in the current scope. In C/C++, uninitialized variables contain no significant value. Your values may be different than these. Watch this panel as we move forward in the lab - it will always contain the current values of the active variables.
Step Over
Now, to run through the program press the F6 key (“Step over”). Notice how each press of the F6 key makes the debugger run through a single line. If you look at the console (in the bottom of the screen), you will see the program’s output (you will have to focus on the console whenever a program line includes an input operation). Keep on running through the program until you reach the end of the program, observing how the values of the variables change. When you reach scanf lines you will need to enter appropriate values into the console.
Step Into
Step over treats each line as a single step, this includes function calls. Sometimes we want to see what happens within a function. For this we will use step into.
Run through the program in debug mode again. This time, when the green bar is on the line
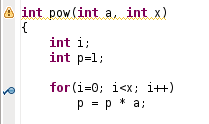
p = pow(a,x);Press the F5 / step into key. This will take you inside the pow function. You can now press F6 to step through these lines until this function returns.
Notice how the contents of the “Variables” tab changes. Run through the function line by line and observe how the values of the variables change. This function is an excellent example of a simple for loop.
We encourage you to run this program a few times with different inputs. Each time you should step into the pow function and watch the for loop work. It is important to understand exactly how loop structures behave.
Breakpoints
Running through the entire program line by line (from beginning to end) can be slow. Sometimes, we might want to debug a very specific piece of code. In that case, we can specify a breakpoint. When using breakpoints, the debugger runs the program as usual and only pauses (and switches to “line-by-line mode”) when it encounters a breakpoint.
For example, we can place a breakpoint when the pow() function is called. To do this, double-click on the left margin of the line where you want to place the breakpoint. A little blue icon will appear:
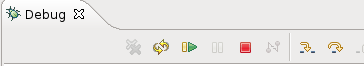
When you start debugging the program, it will be paused in the first line as before. We can tell the debugger to start running the program until it encounters a breakpoint. Do this either by pressing F8 or click on the “Resume” button in the “Debug” tab. It is a green triangle that looks like a little “Play” button:
The program will ask you for the values of a and x, but you will not have to run through that part of the program line by line. When you reach the call to pow(), the debugger will pause execution. At this point, if you press F6 as before, you will “Step Over” the function call. If you actually wanted to debug the pow() function, you can press the F5 key (“Step Into”), which instructs the debugger to step into the function that is being called.
Make your own project
We will now go through all the steps necessary to use Eclipse for your homework. Your svn directory also contains directories named hw1-geometry, hw1-weight, and hw1-cats. These are the three problems for HW1.
Lets get started on the homework by creating an Eclipse project for the first part of HW1, hw1-geometry. Make an Eclipse project whose name matches the name of the directory (hw1-geometry in this case). Ensure that the geometry.c file is accessible in Eclipse.
We want to make sure that you know how to submit your work via svn. To test this we’re going to make a very small change to this file and then submit that small change up to the server.
Add your name at the top just after the text Author:
Open up a terminal (if you don’t have one up already) and cd to your svn directory
cd               # this resets your location to /home/username
cd username-152
(change username to your username). Now check in your work with an informative message
svn ci -m"Added name to geometry.c file"That’s it! You should see some text that says transmitting hw1-geometry/geometry.c Your changes have been submitted and can be seen by the graders and the instructor.
We encourage you now to start working on your homework while you have teaching staff present. Alternatively you can go outside and enjoy the sun.