Programmatic Bokeh Servers
This work is supported by Continuum Analytics
This was cross posted to the Bokeh blog here. Please consider referencing and sharing that post via social media instead of this one.
This blogpost shows how to start a very simple bokeh server application programmatically. For more complex examples, or for the more standard command line interface, see the Bokeh documentation.
Motivation
Many people know Bokeh as a tool for building web visualizations from languages like Python. However I find that Bokeh’s true value is in serving live-streaming, interactive visualizations that update with real-time data. I personally use Bokeh to serve real-time diagnostics for a distributed computing system. In this case I embed Bokeh directly into my library. I’ve found it incredibly useful and easy to deploy sophisticated and beautiful visualizations that help me understand the deep inner-workings of my system.
Most of the (excellent) documentation focuses on stand-alone applications using the Bokeh server
$ bokeh serve myapp.py
However as a developer who wants to integrate Bokeh into my application starting up a separate process from the command line doesn’t work for me. Also, I find that starting things from Python tends to be a bit simpler on my brain. I thought I’d provide some examples on how to do this within a Jupyter notebook.
Launch Bokeh Servers from a Notebook
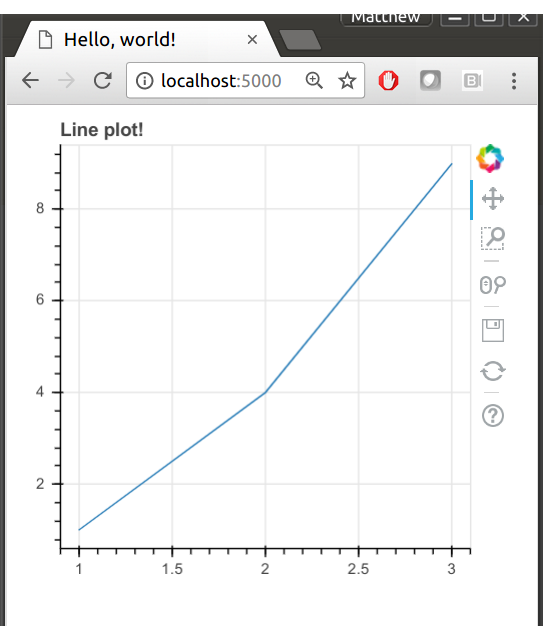
The code below starts a Bokeh server running on port 5000 that provides a
single route to / that serves a single figure with a line-plot. The imports
are a bit wonky, but the amount of code necessary here is relatively small.
from bokeh.server.server import Server
from bokeh.application import Application
from bokeh.application.handlers.function import FunctionHandler
from bokeh.plotting import figure, ColumnDataSource

def make_document(doc):
    fig = figure(title='Line plot!', sizing_mode='scale_width')
    fig.line(x=[1, 2, 3], y=[1, 4, 9])

    doc.title = "Hello, world!"
    doc.add_root(fig)

apps = {'/': Application(FunctionHandler(make_document))}

server = Server(apps, port=5000)
server.start()
We make a function make_document which is called every time someone visits
our website. This function can create plots, call functions, and generally do
whatever it wants. Here we make a simple line plot and register that plot with
the document with the doc.add_root(...) method.
This starts a Tornado web server and creates a new image whenever someone connects, similar to libraries like Tornado, or Flask. In this case our web server piggybacks on the Jupyter notebook’s own IOLoop. Because Bokeh is built on Tornado it can play nicely with other async applications like Tornado or Asyncio.
Live Updates
I find that Bokeh’s real strength comes when you want to stream live data into the browser. Doing this by hand generally means serializing your data on the server, figuring out how web sockets work, sending the data to the client/browser and then updating plots in the browser.
Bokeh handles this by keeping a synchronized table of data on the client and
the server, the ColumnDataSource. If you define plots around the column data
source and then push more data into the source then Bokeh will handle the rest.
Updating your plots in the browser just requires pushing more data into the
column data source on the server.
In the example below every time someone connects to our server we make a new
ColumnDataSource, make an update function that adds a new record into it,
and set up a callback to call that function every 100ms. We then make a plot
around that data source to render the data as colored circles.
Because this is a new Bokeh server we start this on a new port, though in
practice if we had multiple pages we would just add them as multiple routes in
the apps variable.
import random

def make_document(doc):
    source = ColumnDataSource({'x': [], 'y': [], 'color': []})

    def update():
        new = {'x': [random.random()],
               'y': [random.random()],
               'color': [random.choice(['red', 'blue', 'green'])]}
        source.stream(new)

    doc.add_periodic_callback(update, 100)

    fig = figure(title='Streaming Circle Plot!', sizing_mode='scale_width',
                 x_range=[0, 1], y_range=[0, 1])
    fig.circle(source=source, x='x', y='y', color='color', size=10)

    doc.title = "Now with live updating!"
    doc.add_root(fig)

apps = {'/': Application(FunctionHandler(make_document))}

server = Server(apps, port=5001)
server.start()
By changing around the figures (or combining multiple figures, text, other visual elements, and so on) you have full freedom over the visual styling of your web service. By changing around the update function you can pull data from sensors, shove in more interesting data, and so on. This toy example is meant to provide the skeleton of a simple application; hopefully you can fill in details from your application.
Real example
Here is a simple example taken from Dask’s dashboard that maintains a streaming time series plot with the number of idle and saturated workers in a Dask cluster.
def make_document(doc):
    source = ColumnDataSource({'time': [time(), time() + 1],
                               'idle': [0, 0.1],
                               'saturated': [0, 0.1]})

    x_range = DataRange1d(follow='end', follow_interval=20000, range_padding=0)

    fig = figure(title="Idle and Saturated Workers Over Time",
                 x_axis_type='datetime', y_range=[-0.1, len(scheduler.workers) + 0.1],
                 height=150, tools='', x_range=x_range, **kwargs)
    fig.line(source=source, x='time', y='idle', color='red')
    fig.line(source=source, x='time', y='saturated', color='green')
    fig.yaxis.minor_tick_line_color = None

    fig.add_tools(
        ResetTool(reset_size=False),
        PanTool(dimensions="width"),
        WheelZoomTool(dimensions="width")
    )

    doc.add_root(fig)

    def update():
        result = {'time': [time() * 1000],
                  'idle': [len(scheduler.idle)],
                  'saturated': [len(scheduler.saturated)]}
        source.stream(result, 10000)

    doc.add_periodic_callback(update, 100)
You can also have buttons, sliders, widgets, and so on. I rarely use these personally though so they don’t interest me as much.
Final Thoughts
I’ve found the Bokeh server to be incredibly helpful in my work and also very approachable once you understand how to set one up (as you now do). I hope that this post serves people well. This blogpost is available as a Jupyter notebook if you want to try it out yourself.
blog comments powered by Disqus