HTML outputs in Jupyter Visual design. For Science!
Summary
User interaction in data science projects can be improved by adding a small amount of visual deisgn.
To motivate effort around visual design we show several simple-yet-useful examples. The code behind these examples is small and accessible to most Python developers, even if they don’t have much HTML experience.
This post in particular focuses on Jupyter’s ability to add HTML output to any object. This can either be full-fledged interactive widgets, or just rich static outputs like tables or diagrams. We hope that by showing examples here we will inspire some throughts in other projects.
This post was supported by replies to this tweet. The rest of this post is just examples.
Iris
I originally decided to write this post after reading another blogpost from the UK Met office, where they included the HTML output of their library Iris in a a blogpost

(work by Peter Killick, post by Theo McCaie)
The fact that the output provided by an interactive session is the same output that you would provide in a published result helps everyone. The interactive user gets high quality feedback, and there is no productionizing step as we move from the nitty-gritty of development to polish of publication.
Shapely
Shapely deals with shapes, such as are used in geographic information systems. They render themselves just as shapes in Jupyter using SVG.
from shapely.geometry import Polygon

Polygon([(0, 0), (0, 1), (1, 0)])
Note that the image that you see above isn’t an image like a PNG or JPEG. It’s SVG. If you were to look at the source of this post you would see the actual values and content of the triangle.
(Thanks to Andy Jones for the pointer)
Logs
This logs widget provides collapsable log outputs from a set of workers in a cluster.

The code for these is simple. Here’s the implementation for the logs widget
class Log(str):
    """A container for logs."""

     def _widget(self):
        from ipywidgets import HTML
        return HTML(
            value="<pre><code>{logs}</code></pre>".format(logs=self)
        )

     def _ipython_display_(self, **kwargs):
        return self._widget()._ipython_display_(**kwargs)


 class Logs(dict):
    """A container for multiple logs."""

     def _widget(self):
        from ipywidgets import Accordion
        accordion = Accordion(children=[log._widget() for log in self.values()])
        [accordion.set_title(i, title) for i, title in enumerate(self.keys())]
        return accordion

     def _ipython_display_(self, **kwargs):
        return self._widget()._ipython_display_(**kwargs)
This solves a common usability problem, of getting blasted with a ton of output in Jupyter and then having to scroll around. Using relatively simple HTML helps us avoid this deluge of information and makes it much more nicely navigable.
(Work by Jacob Tomlinson)
Xarray
Here is another in a PR for Xarray.
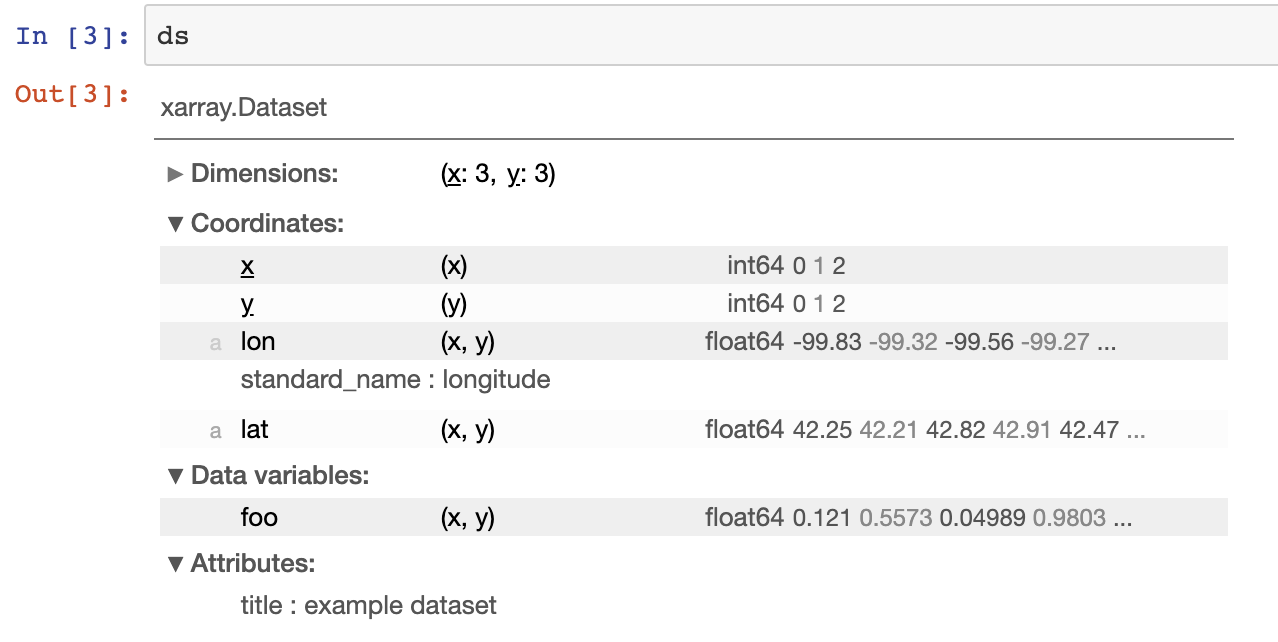
It’s all about optionally exposing information, you can play with it over at nbviewer.
(Work by Benoit Bovy)
Snakeviz
The Snakeviz project makes it easy to visualize and interact with profiling output. (I personally love this project (thanks Matt Davis!)
Now that it can embed its output directly in Jupyter it’s even easier to use.
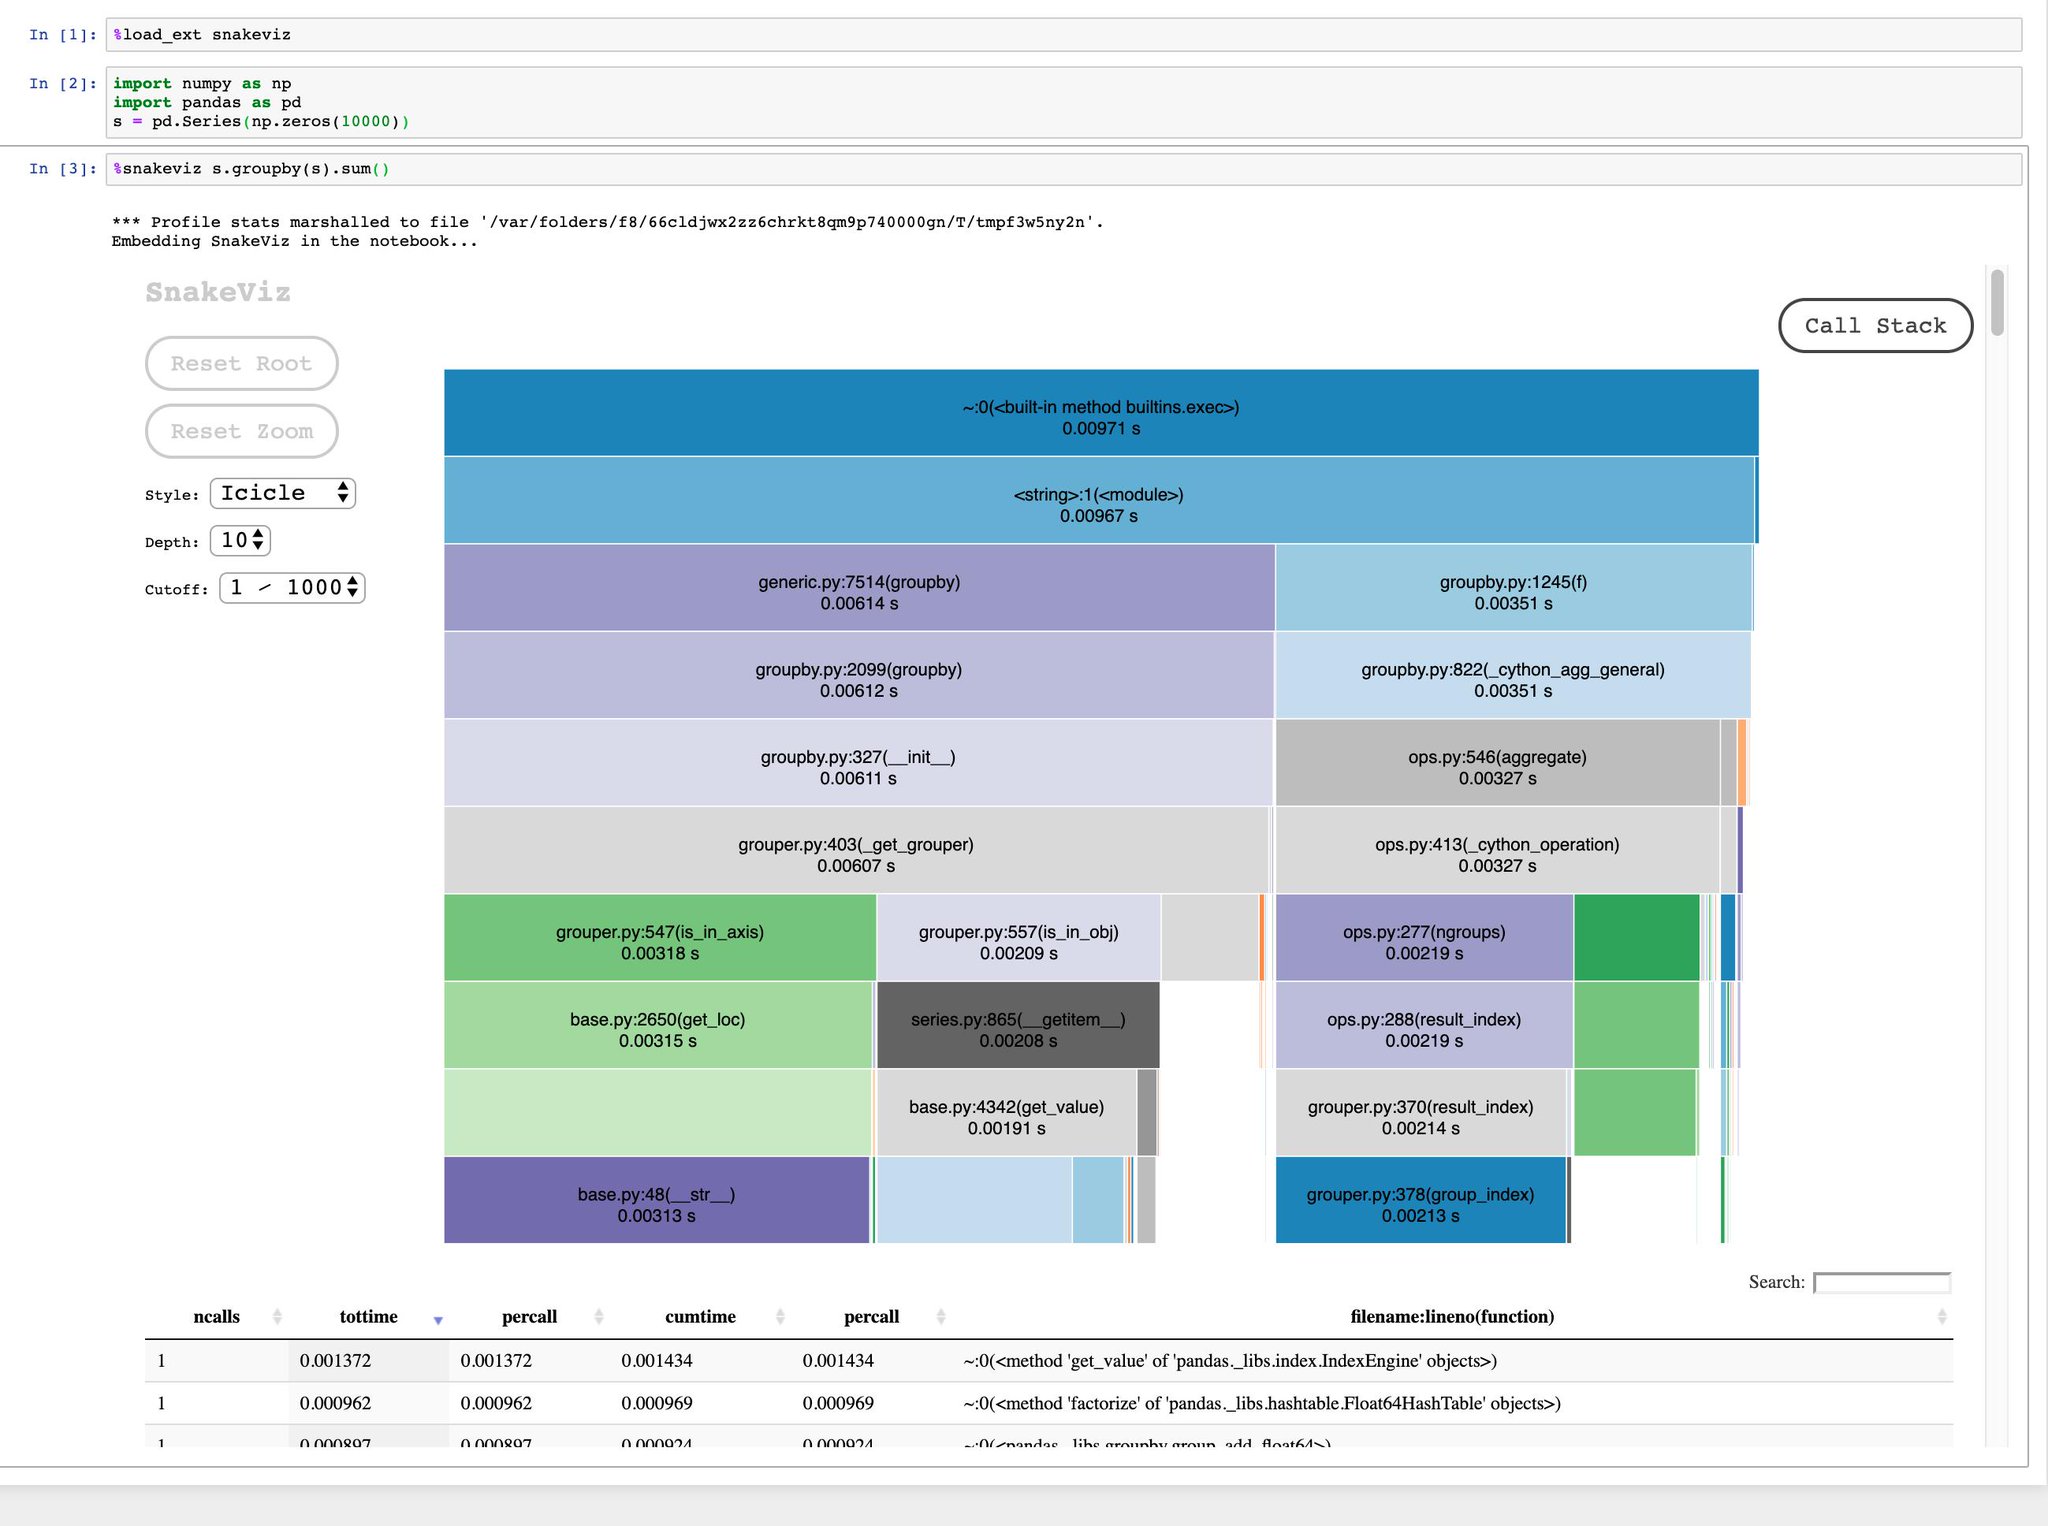
(Thanks to Andy Jones for the tip)
SymPy
SymPy uses unicode for its rich outputs. This makes it valid both in the notebook and also in the console.
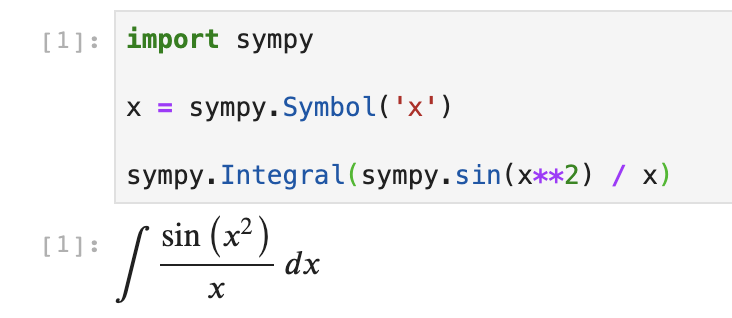
These outputs are critical when trying to understand complex mathematical equations. They make SymPy pragmatic for analyzing mathematical equations.
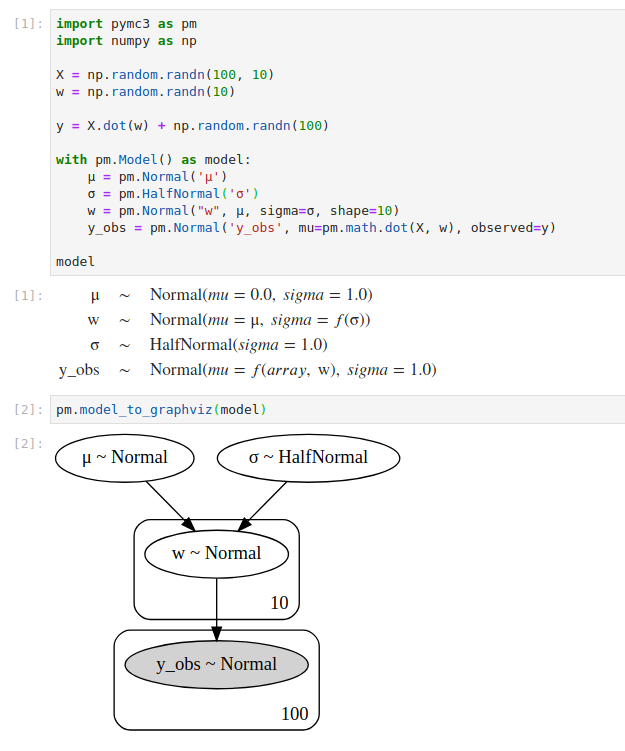
PyMC3
As Colin Carroll says, “PyMC3 borrowed _repr_latex_ from sympy, and
the graphviz graph from dask-delayed”
Dask Array
Inspired by these I took a look at how we render Dask Arrays to the screen
In [1]: import dask.array as da

In [2]: da.ones((10, 1024, 1024), chunks=(1, 256, 256))
Out[2]: dask.array<ones, shape=(10, 1024, 1024), dtype=float64, chunksize=(1, 256, 256)>
Which, while compact, could be improved. I spent a day and made this.

It was designed around common problems I’ve had in trying to convey information about chunking to new users of the library (this commonly translates into performance problems for novices). I found myself relying on it for chunking information almost immediately. I think it will do a lot of good, it looks nice, and was easy to implement.
Richer Visualization Libraries
The examples above are all fairly simple relative to proper visualization or widget libraries like Bokeh, Altair, IPyLeaflet, and more. These libraries use far more sophisticated HTML/JS to get far more exciting results.
I’m not going to go too deeply into these more sophisticated libraries because my main intention here is to encourage a broader use of rich outputs by the rest of us, even those of us that are not sophisticated with web frontend technologies.
Final thoughts
We should do more of this. It’s easy and impactful.
Even if you know only a little bit of HTML you can probably have a large impact here. Even very sophisticated and polished libraries like NumPy or Scikit-Learn have, I believe, a lot of low hanging fruit here. It’s a good place to have impact.
blog comments powered by Disqus